5 Factors That Shape Property Development ROI
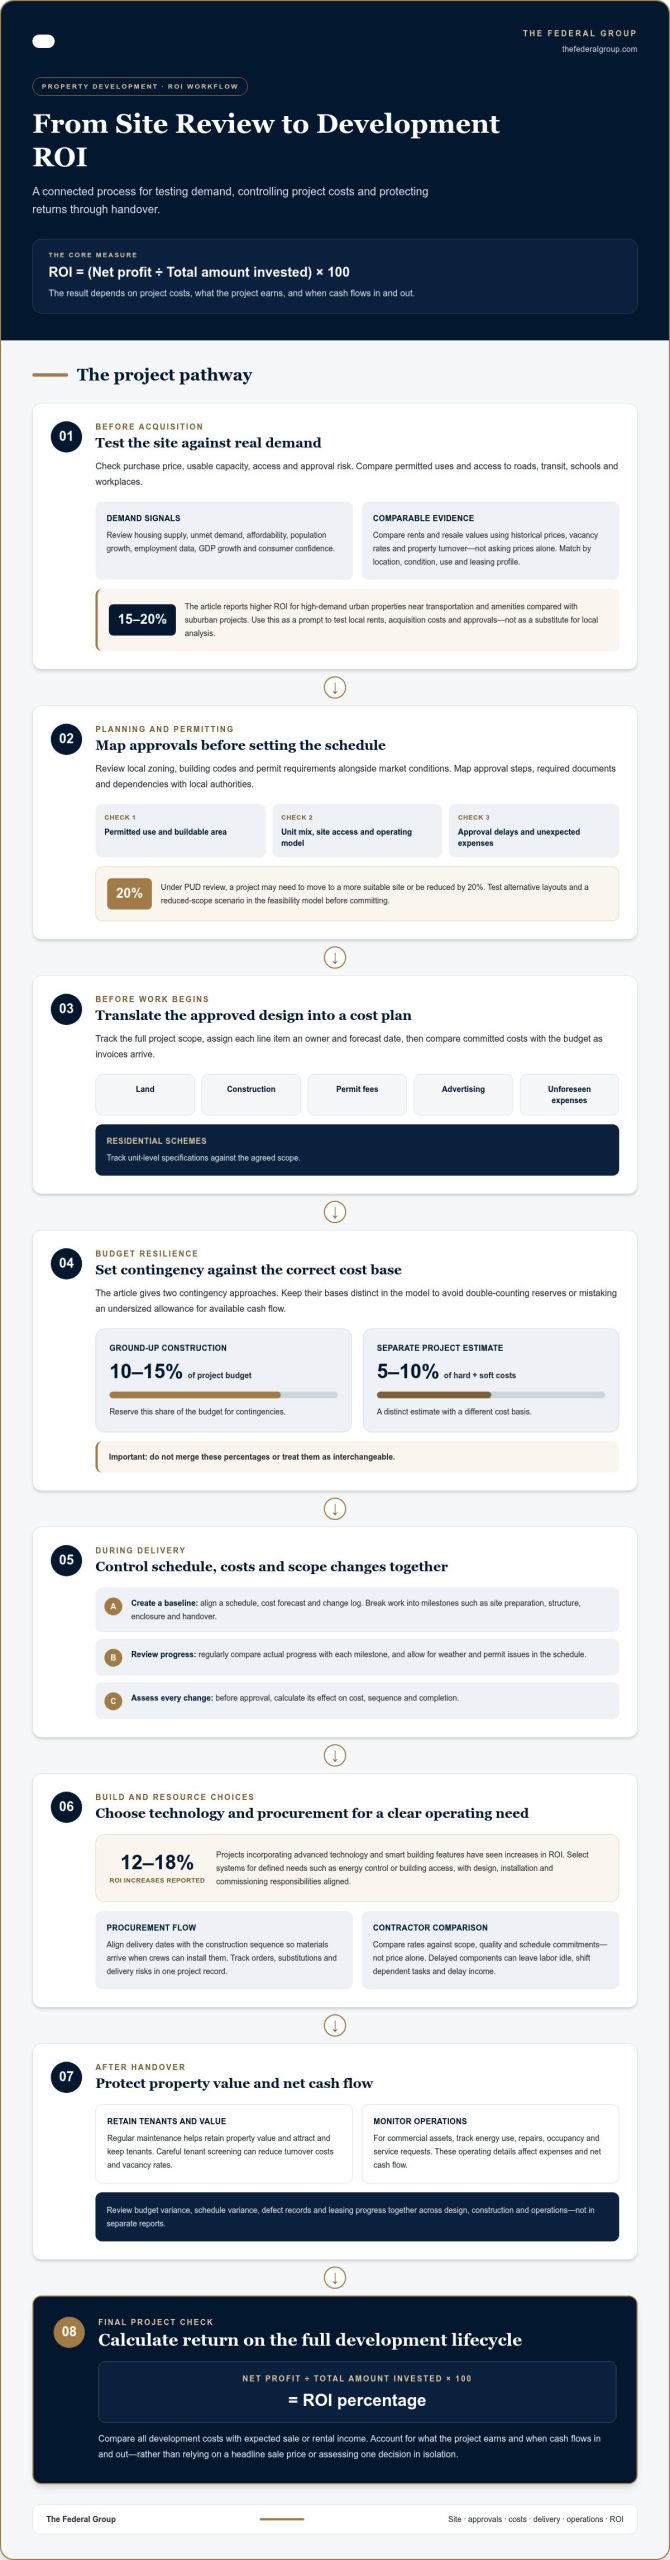
23 October 2026A high sale price doesn’t guarantee a strong development return. Maximizing ROI in property development starts with a clear equation: divide net profit by the total amount invested, then multiply by 100 to express the result as a percentage. The outcome depends on what the project costs, what it earns, and when cash flows in and out.
That’s why neither a promising site nor a controlled build budget can be assessed in isolation. Planning and permitting affect timing and expenses, construction choices shape upfront costs and future operating performance, and financing can amplify gains as well as risk.
This article breaks down five factors that influence property development ROI: regulatory and market constraints, construction and budgeting decisions, financial feasibility and risk, return metrics such as net present value and internal rate of return, and the cost-profit equation. Assessing these factors together helps ensure projected returns reflect the full development lifecycle, not just a headline figure.
Key Takeaways
- Assess local demand, zoning, and permitting constraints early to spot factors that could affect a project’s timeline and viability.
- Build a realistic budget that accounts for construction choices, project schedules, and unexpected expenses.
- Test how changes in rents, costs, and occupancy could affect returns before committing capital.
- Use complementary measures such as net present value, internal rate of return, and payback period to evaluate timing as well as projected profit.
- Compare the full costs of development with expected sale or rental income to identify which decisions have the greatest influence on the final return.
1. Regulatory, permitting, and market constraints
Land acquisition and site selection affect returns through purchase price, usable capacity, access, and approval risk. A low-cost parcel can undermine a project if infrastructure needs, restrictions, or delays increase expenses. Before estimating its potential, compare permitted uses and access to roads, transit, schools, and workplaces.
Developers assess demand, comparable rents, and resale values by reviewing historical prices, vacancy rates, and property turnover. Compare similar properties by location, condition, use, and leasing profile, rather than relying on asking prices alone. Check whether household growth, affordability, job creation, and planned development support the projected tenant or buyer pool.
Begin local market analysis with housing supply, unmet demand, affordability, and population growth. Employment data, GDP growth, and consumer confidence can help assess an area’s economic outlook. Together, these indicators help distinguish sustained demand from interest driven by a short-term trend.
Tools such as Zillow, Redfin, and local government websites can provide an initial market picture. Cross-check listings against historical prices, vacancy rates, property turnover, and planned infrastructure. Sites near universities, hospitals, and business districts may attract higher rents and retain value better. Road access, schools, transit, and workplaces also shape a site’s appeal to residents and tenants.
Commercial real estate analysis should map supply and demand by asset type, tenant profile, and competing inventory. Compare rents and vacancy rates, then assess regulations, infrastructure, economic indicators, and property-value trends. A warehouse, office, or retail project needs evidence that its planned use matches local business demand.
Assess regulations alongside market conditions before acquiring land. Review local zoning, building codes, and permit requirements during planning, since approvals can cause delays and unexpected expenses. Map approval steps, required documents, and dependencies with local authorities before setting the development schedule. Planning conditions may change the buildable area, unit mix, site access, or operating model.
According to U.S. Government Publishing Office, under PUD review, a project may need to move to a more suitable site or be reduced by 20%. That change can affect unit count, revenue assumptions, and land economics. Test alternative layouts and a reduced-scope scenario in the feasibility model before committing.
Properties in high-demand urban areas near transportation and amenities show 15-20% higher ROI compared with suburban projects. Use this market comparison as a prompt to test local rents, acquisition costs, and approval conditions. Strong demand cannot offset an inflated land price or weak demand for the proposed use. Link each research finding to a project assumption, such as achievable rent, resale value, occupancy, or timing.
2. Construction technology, budgeting, and resource management
Translate the approved design into a cost plan before work begins. Separate land, construction, permit fees, advertising, and unforeseen expenses. Assign each line item an owner and forecast date. This makes it easier for the project team to compare committed costs with the budget as invoices arrive. For a residential scheme, track unit-level specifications against the agreed scope.
Set a contingency appropriate to the budget basis. A ground-up construction project can reserve 10-15% of its budget for contingencies. A separate project estimate may use 5-10% of hard and soft costs as a contingency. Keep the bases distinct in the model. Otherwise, teams may double-count reserves or mistake an undersized allowance for available cash flow.
Manage delivery with a baseline schedule, cost forecast, and change log. Break construction into milestones such as site preparation, structure, enclosure, and handover. Review actual progress against each milestone regularly. When a contractor proposes a scope change, calculate its effect on cost, sequence, and completion before approving it. Allow for weather and permit issues in the schedule rather than reacting at the last minute.
Construction technology can affect delivery and operating performance. Projects incorporating advanced technology and smart building features have seen 12-18% increases in ROI. Select systems against a defined operating need, such as energy control or building access. Align design, installation, and commissioning responsibilities. Technology adds value when it supports tenant demand and can be maintained after occupancy.
Manage labor and materials as linked resources. Align procurement dates with the construction sequence so materials arrive when crews can install them. Compare contractor rates against scope, quality, and schedule commitments, not price alone. Track orders, substitutions, and delivery risks in one project record. A late component can leave labor idle, shift dependent tasks, and delay income from leases or sales.
Resource discipline continues after handover. Regular maintenance helps retain property value and attract and keep tenants. Careful tenant screening can reduce turnover costs and vacancy rates. Working with an established firm such as E&S Property Management may suit investors who cannot manage day-to-day operations directly. For commercial assets, monitor energy use, repairs, occupancy, and service requests. These operating details affect expenses and net cash flow.
Apply the same control logic across design, construction, and operations. Review budget variance, schedule variance, defect records, and leasing progress together, rather than in separate reports. This reveals whether a saving shifts costs into maintenance or weakens tenant appeal. For projects requiring coordinated construction delivery, consider an integrated development approach as part of the execution plan.
3. Financial feasibility and risk assessment
A feasibility model connects acquisition, development, financing, and exit assumptions. Start with the purchase price, projected repair costs, and expected rental income or sale value. Then map when expenses occur and income arrives. Timing matters: a project can appear profitable overall yet face cash pressure before completion. Separate assumptions from known commitments so investors can test how changes affect the forecast.
Use cash-on-cash return to measure annual pre-tax cash flow against total cash invested. This shows the cash income generated by an investor’s capital. For a rental property, model occupancy, rent collection, and operating expenses. For a sale-led development, project sales timing and proceeds. Residential properties may offer steady rental yields, while commercial properties may offer higher returns alongside potentially higher risks.
Financial modeling can reduce uncertainty by exposing assumptions that drive results. Thorough market research and financial modeling can reduce project risks by 20-25%. Build a detailed risk assessment around construction delays, leasing, operating costs, and exit values. Assign each risk a financial effect and a response, such as changing the unit mix or adjusting the delivery sequence.
Run sensitivity analysis before committing capital. Test a 5% decrease in rents and a 10% increase in costs, then examine how occupancy and operating expenses affect ROI. If both changes occur together, calculate the revised cash flow and financing needs. This scenario shows whether the project can absorb pressure without relying on its most optimistic assumptions.
Financing structure affects both the cost of capital and the investor’s equity position. Borrowed funds can increase buying power and amplify returns, but they also increase risk. Positive leverage occurs when a commercial property yields more than its borrowing costs. Compare projected property income with interest and repayment obligations, then assess whether cash flow can support debt through leasing or construction delays.
Ground-up construction loans are typically short-term loans intended to cover building costs. Compare loan-to-cost ratios, interest rates, and repayment structures, including interest payable during construction. A lower initial equity requirement can increase exposure if delivery slows or income starts later than forecast. Development delays can increase losses through holding and opportunity costs, so model these effects against the loan timeline.
Review the model as conditions change. Track operating income, property taxes, and loan interest rates, since each affects net income and available cash. Cash flow is the net amount transferred into and out of a business. Reforecast after a tenant change, cost revision, or schedule shift. This disciplined analysis helps investors spot challenges early and decide whether to preserve, restructure, or enhance the project plan.
4. Net present value, internal rate of return, and payback period
Net present value (NPV) discounts future cash flows to assess their value today. In a simplified development example, a project costs $20 million and generates $30 million in cash flow over 10 years. Using an 8% discount rate, the example reports an NPV of +$3.5 million. A positive result indicates projected cash flows exceed the initial investment under those assumptions.
NPV depends on the timing and size of each cash flow, plus the discount rate. Investors can compare the result with a minimum acceptable return, such as the 12% example used in development analysis. Recalculate NPV when completion dates, projected income, or costs change. A delayed sale can reduce present value even if the eventual proceeds stay unchanged.
Internal rate of return (IRR) is the discount rate at which projected cash flows produce an NPV of zero. It accounts for the time value of money and helps compare investments with different cash-flow patterns and holding periods. The simplified example reports a 12.4% IRR over 10 years. Compare that figure with the project’s required return and the assumptions supporting its forecast.
The same example gives a payback period of 6 years. This measure shows how long projected cash flows take to recover the initial investment. It offers a clear view of capital recovery, but does not show returns after payback or fully reflect cash-flow timing. Read it alongside NPV and IRR, not as a standalone measure of return on investment.
Value-add improvements can strengthen an existing commercial property’s income and property value. This strategy involves buying a property to improve or renovate it, then assessing how those changes affect rents, occupancy, and resale potential. Reconfiguring commercial spaces to match market demand is stated to yield 20-40% ROI. Economic indicators, including employment data and GDP growth, can inform forecasts for local demand and future property values.
Control improvement costs through value engineering. Compare materials and construction methods against the required function, durability, and operating performance. LED lighting conversions, smart building systems, and HVAC optimization are stated to have 1-3 year payback periods. For each measure, compare installation costs with projected savings and confirm how its timing affects the wider project cash flow.
Tax rules affect net returns through available deductions and incentives. Investors may be able to claim deductions for depreciation, property tax, and mortgage interest; a tax professional can assess applicable benefits. According to the Internal Revenue Service, after holding a Qualified Opportunity Fund investment for at least 10 years, an investor may elect to adjust its basis to fair market value when it is sold or exchanged.
5. Property development ROI and the cost-profit equation
Property development ROI equals net profit divided by total investment, multiplied by 100. Include acquisition, construction, permitting, financing, marketing, and holding expenses in the investment total. Subtract those costs from sale proceeds or rental income to estimate net profit. Leaving out one cost category can overstate the return and distort comparisons between projects.
For example, a 24% return on a $1 million initial investment equals $240,000 in profit. That figure assumes the return is calculated against the stated initial investment. It doesn’t describe a guaranteed outcome, or explain how long the capital remains committed. Investors should compare like-for-like projects using the same cost categories and time horizon.
Which strategies typically produce the highest ROI? The strongest opportunities often align improvements with proven demand, rather than relying on broad upgrades. Reconfiguring commercial space to match market demand is stated to yield 20-40% ROI, while strategic renovations can increase property value by 20-30%. Acquiring commercial property during market downturns is stated to generate 20-40% higher returns over a full investment cycle than peak-market acquisitions.
These figures describe distinct strategies, not gains to be added together. A renovation’s value depends on the gap between improvement costs and the income or sale value it unlocks. A reconfiguration may attract tenants if the new layout matches local demand. An acquisition during a downturn still needs a viable exit plan, adequate cash flow, and costs that remain manageable during the holding period.
What are typical construction costs and profit margins in the United States? Construction costs depend on project scope, location, site conditions, materials, labor, and required building specifications. The cited profit-margin ranges are 8-15% for residential projects by home remodelers and 5-10% for large commercial construction projects.
These margins aren’t interchangeable with ROI. Profit margin compares profit with revenue; ROI compares net profit with invested capital. A project with a modest margin can still deliver an attractive ROI if capital turns over efficiently. Conversely, a high projected margin may disappoint if construction overruns or sales take longer than planned.
Test the cost-profit equation against multiple outcomes. Model expected sale proceeds or rental income, then reduce revenue assumptions or increase expense assumptions. Check whether the project still produces acceptable profit under changed market conditions. Sustainable materials and energy-efficient technologies may raise upfront costs, but can increase property value or reduce long-term maintenance costs.
For a development where capital structure and delivery choices shape the cost-profit equation, explore development finance alongside the project model.
The Federal Group: Development Finance
The Federal Group can support developers assessing capital needs and delivery structure for a property project. Its Development Finance and Private Equity offerings can suit projects requiring development capital or an equity partner. Through Design & Build Development, it also operates as an integrated developer, connecting construction decisions with the project’s wider financial objectives.
Consider engaging The Federal Group when a project’s feasibility model is taking shape and its funding structure, delivery approach, and projected returns need to be assessed together. This is a practical next step for developers moving from market analysis into execution, particularly when coordinating finance and development decisions is central to the plan.
To discuss a development project, contact The Federal Group.
Turn your project model into a decision framework
A development model should guide decisions throughout the project, not sit untouched after approval. Turn its key assumptions into review points, assign responsibility for monitoring them, and define what would prompt a change in scope, timing, or capital allocation. This creates a clearer path from the initial investment thesis to delivery and exit.
For developers seeking an aligned partner, The Federal Group offers Development Finance, Private Equity, and Design & Build Development. These capabilities can support projects where funding, investment structure, and delivery strategy need to work together. A focused discussion can help determine whether this combination fits your project’s next stage.
Build the next phase around disciplined decisions and a clear view of the project’s objectives. Discuss your project with The Federal Group and explore a considered approach to maximizing ROI in property development.
Frequently Asked Questions
What metrics are used to measure ROI in property development?
Developers use ROI alongside metrics that reveal income quality, capital efficiency, and timing. Net operating income and capitalization rate help assess an operating asset, while cash-on-cash return focuses on cash invested. For projects with changing cash flows, NPV and IRR add a time-sensitive view. Compare metrics using consistent assumptions and match each measure to the decision: acquisition, hold, refinance, or sale.
How do developers calculate project costs, net profit, and return on investment?
Developers total all project investment, forecast revenue, subtract investment from revenue to estimate net profit, then divide profit by total investment and multiply by 100. Build the cost schedule from land and construction through professional, financing, marketing, and disposal expenses. For a rental exit, project income across the holding period; for a sale, use expected proceeds. Keep assumptions traceable so revisions don’t conceal cost growth.
How do financing costs, leverage, and interest rates affect development ROI?
Financing costs reduce net profit, while leverage can increase equity returns and magnify losses. Include interest during construction, repayment timing, and any changes in borrowing costs in the cash-flow forecast. Then compare the project’s expected yield with its financing cost. If leasing starts later than planned, for example, interest can accumulate before rental income begins, weakening returns and increasing the capital needed to complete the project.
How can developers reduce construction costs without compromising quality?
Developers can control costs by reviewing design choices against function, durability, and whole-life performance. Compare alternative materials and methods for the same specification, then assess maintenance and energy use alongside initial expense. Set clear scope documents before procurement, and assess substitutions for performance and compatibility before approval. Protect essential safety and durability requirements: cutting them may cause defects, repairs, or tenant concerns that erode savings later.
How do zoning, permits, building codes, and impact fees affect project feasibility and ROI?
Zoning determines permitted uses and development capacity, while permits and building codes can shape design, schedule, and construction requirements. Impact fees add project expenses and can reduce the land value a scheme can support. Model these costs before setting an acquisition limit. For example, a required design change may reduce saleable or lettable space while leaving major site and infrastructure expenses unchanged, reducing projected profit.
What are the main financial, construction, market, and regulatory risks in property development?
Key risks include borrowing costs and cash shortfalls, construction delays or defects, weaker tenant or buyer demand, and approval conditions that alter the scheme. Track each risk against a specific forecast assumption. Assign an owner, an early warning indicator, and a response. For example, a slower leasing pace should trigger a review of cash needs and the timing of planned expenditure.
What steps can developers use to build a project feasibility model and maximize ROI?
Start by defining the site, intended use, and exit route. Build a phased schedule of land, development, financing, and operating costs, then forecast sales or rental income using evidence from the chosen market. Test changes to key assumptions, identify conditions that weaken feasibility, and set review triggers for delivery. A disciplined sequence for maximizing ROI in property development links each investment decision to a measurable project objective.